You’ve just wrapped an incredible conference. Thousands attended, dozens of sessions ran, and sponsors are asking for results. But staring at scattered spreadsheets and disconnected reports, you wonder: what does all this data actually mean for your business?
Why Post-Event Analytics Matter More Than Ever
The events industry is booming. The global event industry is forecasted to exceed $1.5 trillion by 2028, growing at an annual rate of 11.2% (Allied Market Research, 2025). Yet despite this growth, 38.2% of organizers still report difficulty demonstrating ROI for B2B conferences (Bizzabo, 2024).
The problem isn’t lack of data—it’s making sense of it. 73% of organizations use one to five different tools to track event results (Fielddrive, 2025), creating disconnected data silos. Each platform tells part of your event story, but without integration, you’re assembling a puzzle with missing pieces.
This is where ai-powered event analytics changes everything. 70% of global meetings professionals now use AI in their workflows (Statista, 2025), recognizing that manual analysis can’t handle modern event complexity.

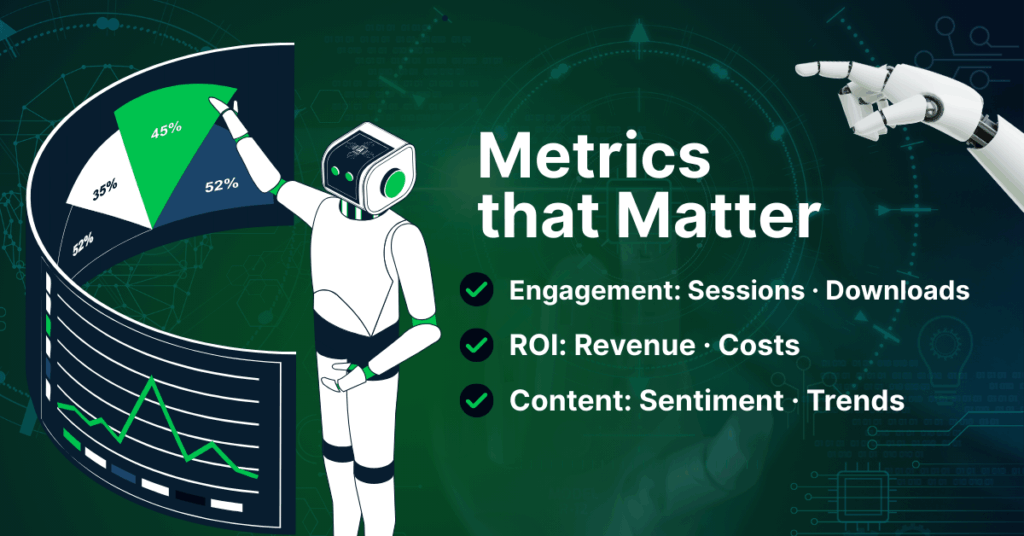
Essential Metrics That Actually Matter
Beyond Basic Attendance Numbers
Forget just counting heads. Track engagement depth through session participation rates, question submissions, and content downloads. Monitor when attendees are most active and where they drop off. These patterns reveal what truly resonates with your audience.
Live event data interpretation AI can process these signals in real-time, spotting trends humans might miss. When someone switches sessions, downloads specific resources, or connects with certain exhibitors, you’re seeing their priorities in action.
Financial Performance Indicators
Most events achieve ROI between 25% and 34% (Fielddrive, 2025), but calculating your return requires tracking both obvious and hidden costs. Revenue isn’t just ticket sales—include sponsorships, exhibitor fees, and post-event purchases. Costs extend beyond venue rental to technology, marketing, and staff time.
Content Performance Through Event Content Analysis AI
Which sessions sparked the most discussion? What topics generated immediate action? Event content analysis AI examines audience sentiment, identifies key themes, and measures information retention through follow-up engagement. This beats relying solely on satisfaction surveys that only capture surface-level feedback.
Building Your Analytics Framework
Start Before Your Event Begins
Success in post-event analytics starts during planning. Set up consistent naming conventions for sessions and speakers. Define what you’ll track at each touchpoint. Create data collection protocols that capture essential information without overwhelming registrants.
Most importantly, decide which metrics matter for different stakeholders. Executives want ROI and strategic impact. Marketing needs lead quality data. Operations requires efficiency metrics.
Implement Event Analytics Automation Software
Event analytics automation software eliminates hours of manual work. These platforms automatically pull data from multiple sources, clean it, and identify patterns. They generate visualizations that make complex relationships clear and highlight anomalies worth investigating.
Gartner predicts AI-powered analytics will revolutionize decision making (Gartner, 2025), especially for complex environments like events where multiple variables interact simultaneously.
Transform Data Into Key Insights Extraction
Raw numbers don’t drive decisions—insights do. Your key insights extraction process should answer three questions: What worked? What didn’t? What should we do next?
Focus on actionable findings. Instead of reporting “500 people attended Session A,” explain what that attendance pattern reveals about audience interests. Rather than just noting satisfaction scores, identify specific improvements that would boost future ratings.
Example in Practice: Snapsight Premium at Scale
At TechWeek Singapore, Snapsight Premium processed content from 50+ sessions for 10,000 attendees, automatically generating personalized insights for each participant. Executives received strategic intelligence about industry trends. Technical professionals got detailed implementation guidance. Sales teams received qualified lead intelligence with context.
This automated personalization at scale—delivering exactly what each stakeholder needs—represents the future of event analytics.
Common Pitfalls to Avoid
Data Quality Issues
Poor data quality causes 30% of AI projects to fail after proof of concept (Gartner, 2025). Incomplete registrations, inconsistent entries, and integration failures corrupt analysis before it starts. Implement validation at every collection point and fix issues immediately.
Tool Overload
More tools don’t mean better insights. Choose platforms that integrate naturally rather than forcing connections. Ensure your team can actually use the tools you select—sophisticated platforms provide no value without proper training.
Key Takeaways
- Define clear objectives before selecting metrics—every analysis should connect to strategic goals
- Focus on actionable metrics that drive decisions, not vanity numbers that just look impressive
- Integrate your data sources to tell complete stories rather than fragmented insights
- Use ai-powered event analytics for routine analysis while humans focus on strategy
- Iterate and improve with each event, building organizational intelligence over time
Transform Your Event Intelligence
Ready to move beyond basic reporting? Snapsight Premium’s advanced analytics automatically detects opportunities, tracks sentiment, and generates personalized intelligence for every stakeholder. See how leading organizations prove ROI and optimize experiences with intelligent event analytics.
Explore Snapsight Premium’s capabilities and discover what your event data has been trying to tell you.

